Verifying Network with Show Commands
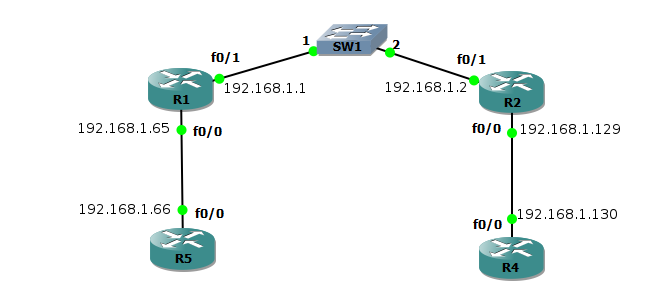
Now that we've got both routers in our network configured we should test everything and verify that we have full connectivity. Since I'm using GNS3 I used routers to simulate hosts for simplicity. This is the topology of my GNS3 network.
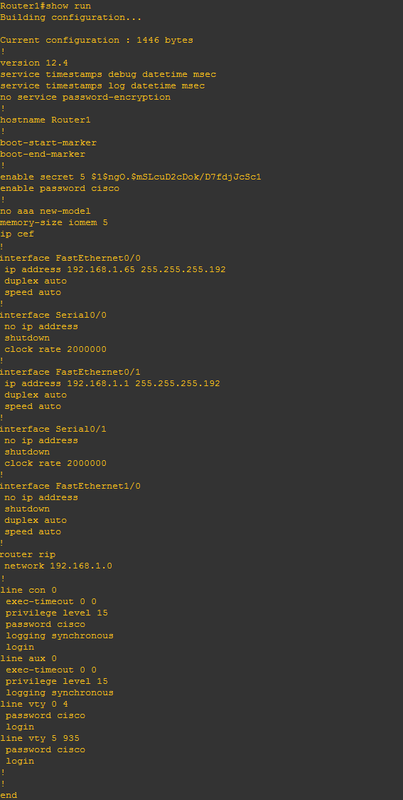
We're going to go over some 'show' commands that will display our configuration settings. Lets get started on router 1. The first thing we'll do is show our running-config. Lets take a look -
Click to Enlarge
There's a lot of information that can be gathered in the running config. From here we should confirm that all of our interfaces have the proper IP addresses assigned. In the output after the interfaces we find the RIP configuration, here we should verify the correct network address has been added. We can also verify that our console, auxiliary, and vty lines are configured with passwords and the login command where needed. Get used to displaying the running-config as it is one of your most important show commands.
Now lets look at the routing table on router 1.
Now lets look at the routing table on router 1.
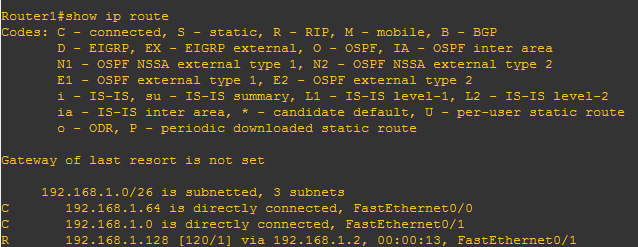
The 'show ip route' command lists our routing table. The routing table lists every route the router has learned. The top of the routing table lists a legend for the codes used to identify each type of connection. You can see these codes next to each route in the routing table.
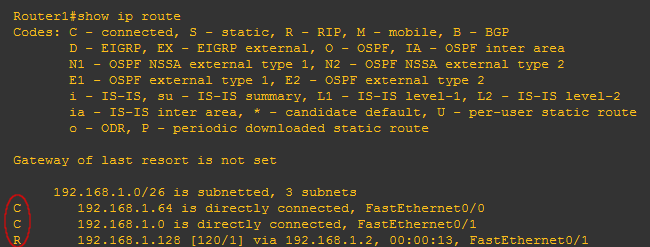
The first 2 routes have a C next to them standing for connected, this means that these 2 subnets are directly connected to the router. The third route has a R after it meaning it was learned from its neighbor with the RIP routing protocol. Which is exactly what we should be seeing on router one.
Looking at the routing table, the first entry is 192.168.1.0/26, which is our network address we subnetted, underneath this entry are the 3 subnets we created and used. The interface the router uses to get to each route is listed at the end of the entries. Router 1 will use FastEthernet 0/1 to get to both the 192.168.1.0 and the 192.168.1.128 network.
Now lets talk a little about the RIP route in the table. The numbers in brackets [120/1] represent 2 important pieces of information. The first number is the administrative distance for the route. If you remember administrative distances are used by routers to define how trustworthy a route is.
The second number in [120/1] is the metric. RIP uses a metric of hop counts, so every time a traffic traverses another layer 3 device it will increment the metric by 1. We'll go over AD and metrics more in the routing protocol section.
So everything looks good in our routing table for router 1. Router 1 learned about the remote network connected to router 2 through RIP. So lets move on to our next show command.
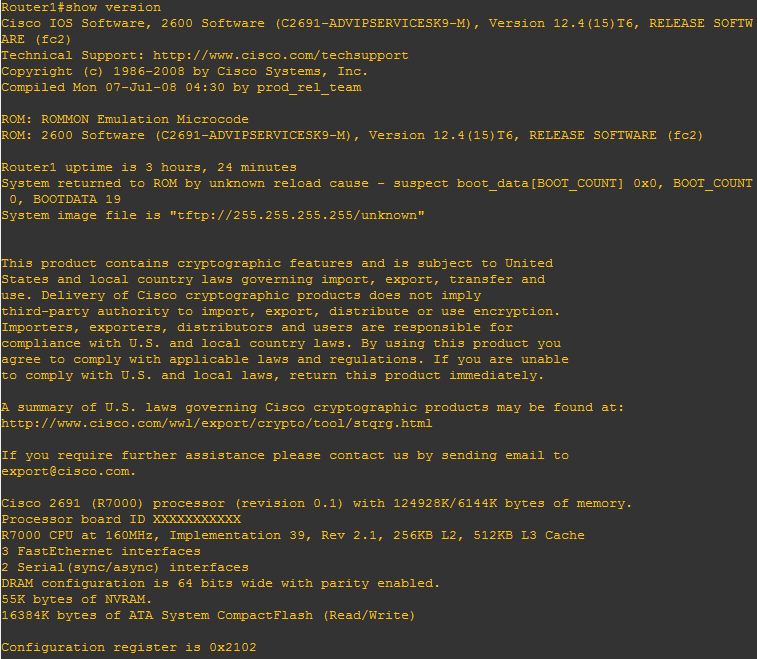
The 'show version' commands lists information on the IOS. The first thing it displays is the series of router you're running. In this case I'm running a 2691 router so the output shows, 'Cisco IOS Software, 2600 software' meaning the IOS software is for a 2600 series router. The next piece of information is the is the IOS image file name. This can be found in parenthesis and for my router is "(C2691-ADVIPSERVICESK9-M)".
You can also find information on the routers hardware such as the CPU, installed interfaces, DRAM, NVRAM, and flash memory. This is a lot of very useful information. If you're upgrade your ISO you need to make sure you have enough memory available, and you need to make sure your router has enough resources to run the ISO.
There is one last piece of information listed in the 'show version' command and that's the Configuration register. We've already discussed how the config registry determines different factors of the boot process in the previous section and now we know where we can confirm the registry. We can see that this router has the default registry telling it to load the IOS from flash and the startup-config from NVRAM.
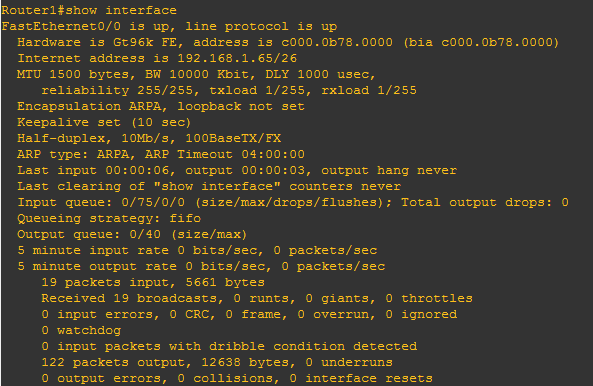
The above image displays the output of the 'show interface' command. This command will display detailed information about each interface. The first line we see,

Represents layer 1. If the interface is missing a cable, or the wrong type of cable is used the output would change to down. The interface looks for something called carrier detect when a line is connected to determine if it is up or down. The second part of the output refers to layer 2. If line protocol is down it can mean an issue with encapsulation, keepalive mismatch, or a clock rate issue.
The next line of the output provides the layer 2 MAC address for this interface. Notice that there are 2 MAC addresses listed, both of them are the same in this instance. But you can actually change your MAC address and doing so would alter the first MAC address of the output. The MAC address in the parenthesis is the Burned In Address, or the permanent burnt in address of the interface.
We see the layer 3 IP address on the next line, it lists the IP address and the CIDR notation for the subnet mask attached to it. You can also find transmission information about the interface such as the Maximum Transmission Unit(MTU), and Bandwidth(BW). The MTU is the maximum size of a packet that the interface will send. The BW is used by certain routing protocols to calculate their metrics.
The ending lines of the output display information about the traffic on the link such as error information. You can see input and output errors and things such as collisions. This is very useful information when troubleshooting congestion issues.
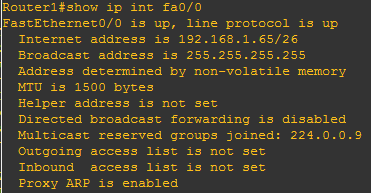
The next command displays addition layer 3 information about an interface. This is a good command for verifying access lists on a interface.
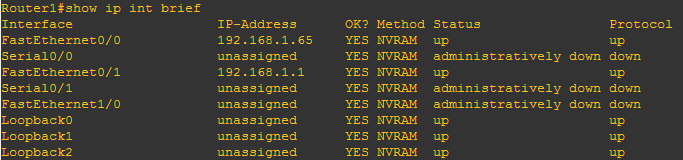
This is the last of the show interface commands. This one is probably the most used show command. It provides really useful information without overloading you and making your search through the output for the info you need. It lists the status of every interface and their IP address if they have one assigned. You can see 3 interfaces are administratively down, this is because I never went into those interfaces and issued the no shutdown command.
Those are the basic show commands you will need to verify your network. There are more that we will go over as we continue throughout the curriculum.
Those are the basic show commands you will need to verify your network. There are more that we will go over as we continue throughout the curriculum.
